Mining TimingFR View all
Activity 3

Characterisation

Establish the mineralogy and liberation of your material before committing capital.

ForMines, exploration juniors, plants, recyclers

A wrong diagnosis can compromise a plant: unsuitable flowsheet, wrong grind size, overestimated recovery.

Our services

What you obtain

Material diagnosis

You receive

Elemental composition, mineral phases, surface chemistry, particle size distribution, interpreted report.

You gain

Process selection and expected recovery are based on measurements.

Liberation curve

You receive

Degree of liberation by grind size, mineral associations, specific energy.

You gain

An optimal grind size: the mineral liberated, without overgrinding.

Campaign monitoring

You receive

Analysis programme repeated at each stage or each month, with quality control.

You gain

Drifts detected early, results comparable over time.

Why us

  • 11 techniques combined, from XRF to combustion, with McGill University
  • Results interpreted and translated into technical decisions
  • Two carbon measurements: XRF and combustion
11analytical techniques
2Hitachi SEMs, SU3500 and SU8000
2diffractometers, Cu and Co
0.25 to 50 ppmcertified ICP standards
99.90%carbon measured on purified graphite
Before, after

The same material, transformed

Drag to compare.

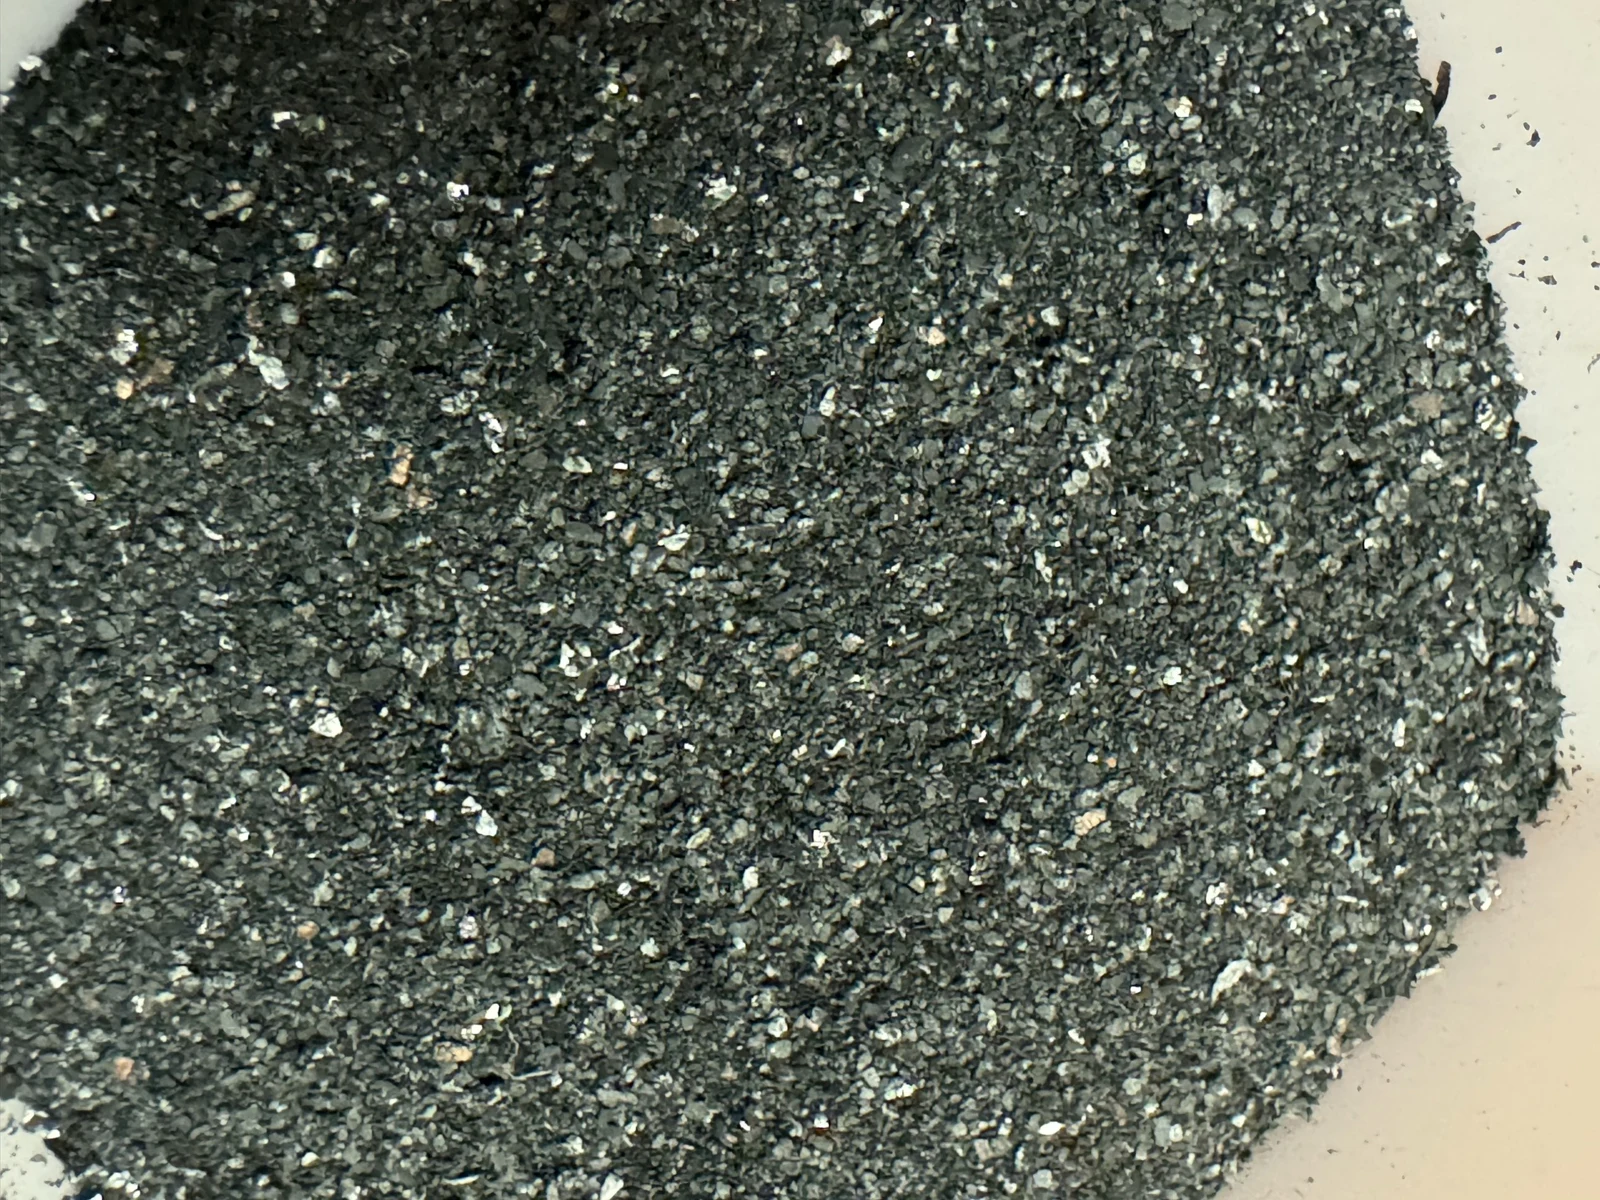
Purified graphite
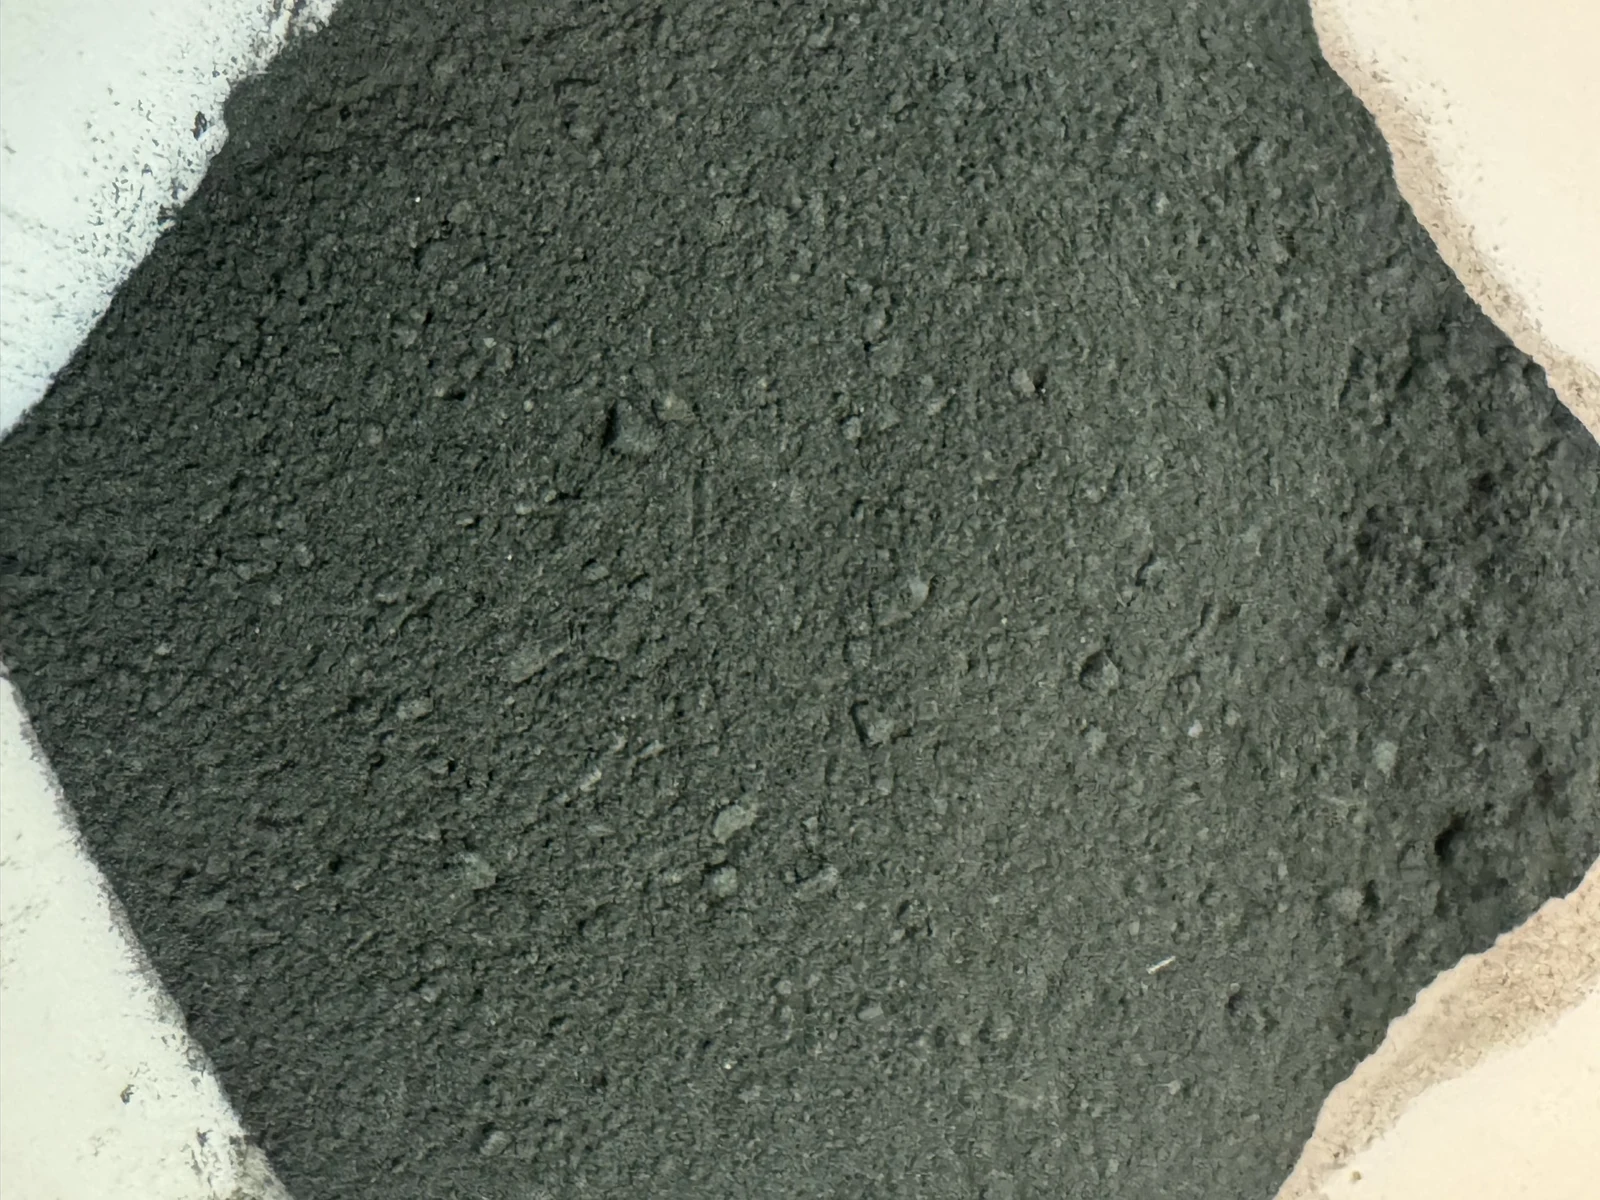
Initial black mass
BEFOREAFTER

Initial black mass, then purified graphite
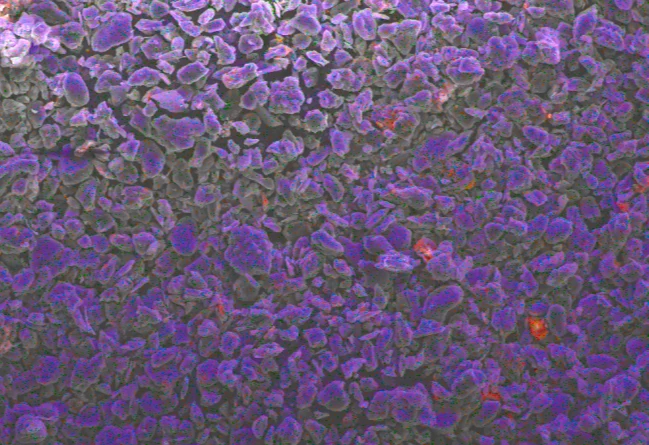
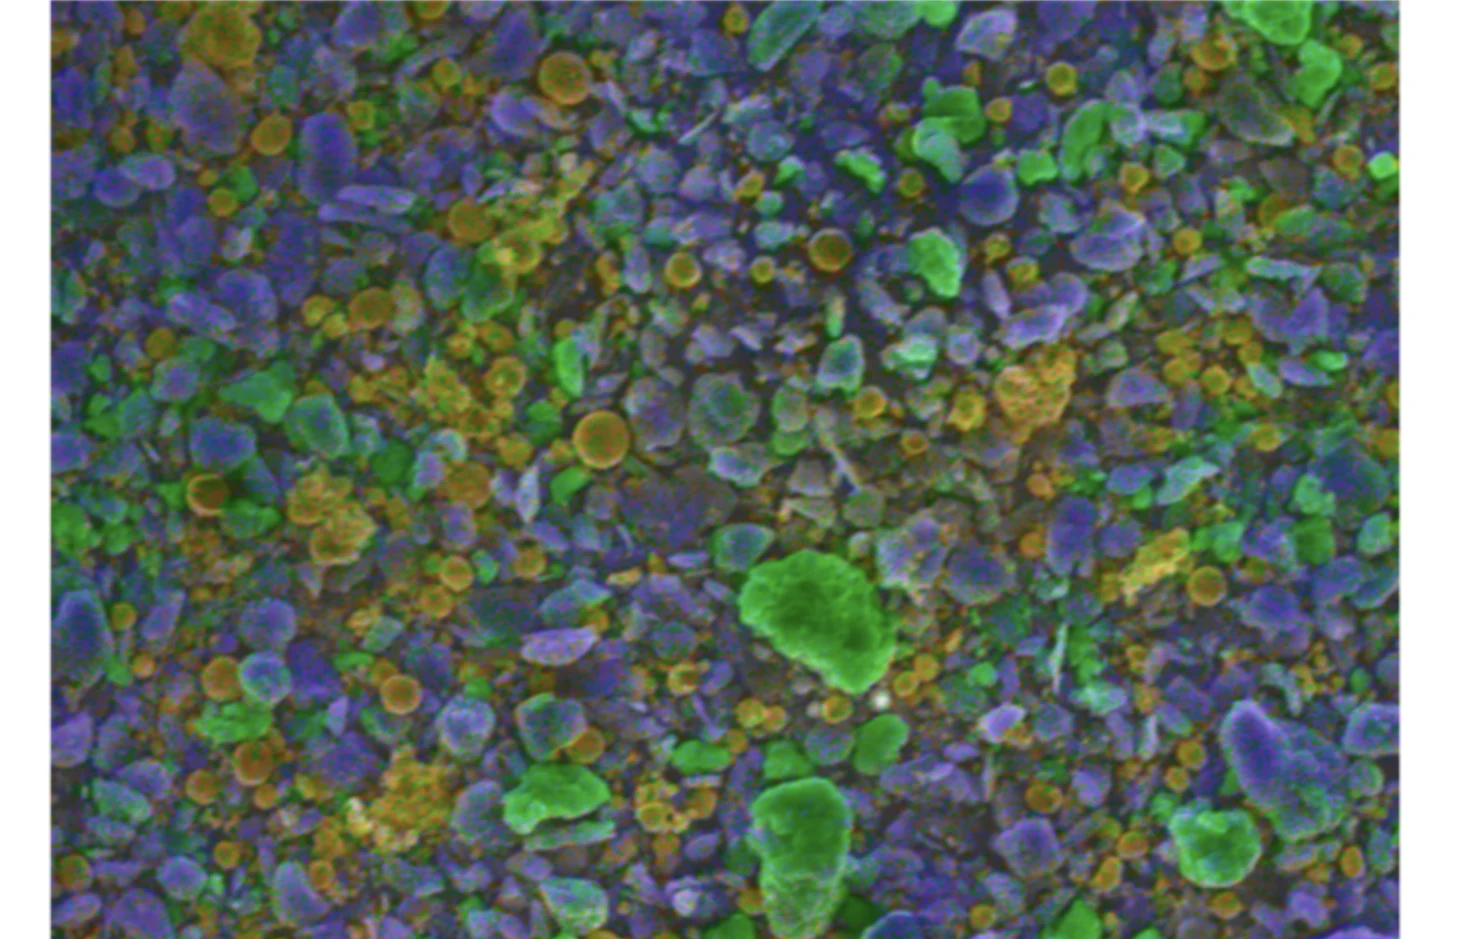
EDS map of the purified graphite
EDS map of the black mass
BEFOREAFTER

EDS map of the black mass, then EDS map of the purified graphite

Research by Y. T. Chegang Kwebou, McGill University (Mineral Processing Group), with the University of Birmingham
Our resources

How we do it

SEM-EDS: seeing the grains

Electron microscopy reveals liberation and mineral associations; EDS maps the elements, grain by grain. The reference tool for qualifying a concentrate or tailings.

Technical data sheetHitachi SU3500 and SU8000 (field emission), EDS Oxford Instruments X-MaxN 80 mm²
  • 15 to 30 kV, secondary and backscattered electrons
  • Round stub: samples on carbon tape and aluminium mount
  • AZtec software: elemental mapping, area spectra, tracking of Cu, Fe, Al, P, F, O

XPS: reading the surface

Surface chemistry explains why a mineral floats or not, and what remains on recycled graphite.

Technical data sheetThermo Scientific K-Alpha (Nexsa G2)
  • Monochromated Al Kα source, hν = 1,486.6 eV
  • Chamber pressure < 5 × 10⁻⁹ mbar
  • Surface analysed over 5 to 10 nm
  • Square sample holder with copper clips
  • Charge compensation, energies referenced to C 1s at 284.8 eV
  • Survey and high-resolution spectra: C 1s, O 1s, F 1s, Li 1s, Co 2p, Ni 2p, Cu 2p, Avantage software

XRD: identifying phases

Which minerals, which crystal structure: the basis for process selection.

Technical data sheetPANalytical Empyrean (Cu Kα) and Bruker D8 Discover (Co Kα)
  • Powder diffraction, DIFFRAC.EVA software
  • Phase identification
  • Graphite (002) reflection: d₀₀₂ by Bragg's law, Lc by the Scherrer equation

Raman: assessing the graphite

The D, G and 2D bands reveal the defects and ordering of the carbon, for both natural and recycled graphite.

Technical data sheetHORIBA LabRAM HR Evolution
  • 532 nm laser, 50× objective, less than 2 mW on the sample
  • 1,000 to 3,200 cm⁻¹, resolution of approximately 1 cm⁻¹
  • D, G, 2D bands, ID/IG ratio, Lorentzian deconvolution

ICP: assaying metals

Digestion, then ICP: precise grades, metallurgical balances, leachates. The colour of the solutions already indicates the dissolved metals.

  • Portable and laboratory X-ray fluorescence for rapid checks
Technical data sheetThermo Scientific iCAP 6000 (ICP-OES), SCP Science DigiPREP Jr digestion
  • 0.1 to 0.5 g: 4 mL HCl 2 h at 95 °C, then 3 mL HNO₃ 2 h at 95 °C
  • Dilution to 50 mL, ultrasound 5 min, syringe filtration
  • Certified standards 0.25 to 50 ppm, 4% HNO₃ blank, duplicates
  • Cu, Fe, Li, Al, P, Ni, Co, Mn, Ca, Mg, Zn

XRF: the bulk composition

The grade of each stream, to track where each metal goes and close the mass balance.

Technical data sheetBruker S8 Tiger, wavelength-dispersive X-ray fluorescence
  • Bulk grades: Ni, Co, Mn, Fe, P, Al, Cu
  • Carbon by difference; NMC indicator = Ni + Co + Mn and LFP indicator = Fe + P
  • −38 µm black mass: 74.63 ± 0.43% C; after WHIMS: 89.48% C; after leaching: 98.24% C

Combustion: measuring carbon

XRF calculates carbon by difference: it counts the lithium and oxygen in cathodes as carbon. Temperature-programmed combustion measures carbon directly and separates graphite from organic and inorganic forms. We provide both measurements.

Technical data sheetElementar soli TOC cube, temperature-programmed combustion
  • 5 mg, four replicates, internal standard
  • Hold at 400 °C then ramp to 900 °C: organic carbon TOC400, graphitic carbon ROC900, inorganic carbon TIC900
  • −38 µm black mass: 56.7% total carbon, of which 45.3% graphitic; after leaching: 86.5% graphitic

Particle size: the size of the grains

Grain size determines liberation, separation and yield. We measure the full distribution at every stage of the process, and compare it before and after each operation.

Technical data sheetMicrotrac SYNC, FLEX software
  • Laser diffraction and dynamic image analysis on the same instrument
  • Range from 0.0215 to 2,000 µm
  • −38 µm black mass: D50 = 16.07 ± 0.13 µm, D80 = 25.82 ± 1.05 µm

Digital microscopy: the first look

A rapid examination of grains and fractions, before committing to longer analyses.

Technical data sheetKeyence digital microscope
  • Direct observation of grains and fractions
  • Check before SEM

Electrochemistry: does the graphite work in a cell?

The purified graphite is assembled into a lithium half-cell at the University of Birmingham. It stores lithium again: proof that recycling succeeds.

Technical data sheetCR2032 half-cells, University of Birmingham
  • Lithium metal, Celgard trilayer separator
  • 1 M LiPF₆ in EC/EMC 3:7 with 2% VC
  • 0.005 to 1.5 V, 10 mA g⁻¹, 25 °C, two formation cycles
  • Lithiation: 358 ± 6 then 301 ± 7 mAh g⁻¹
In 3D
Full screen

Start from an accurate sample

Splitting, screening, drying, mounting: an analysis is only as good as its sample. Our experience also comes from the commercial laboratory, at AGAT Laboratories.

  • Laser particle size analysis, zeta potential, loss on ignition, TGA
Technical data sheetSartorius and Mettler Toledo balances, Thermolyne FB1415M muffle furnace
  • Splitting, screening, drying, mounting
  • Ash content per ASTM C561-16: 1,000 °C, 12 h
  • Carbon by difference; Ni, Co, Mn, Fe, P, Al, Cu assayed
Results

Measured in the laboratory

Research by Y. T. Chegang Kwebou, McGill University (Mineral Processing Group), with the University of Birmingham
With you

How to work with us

  1. Let's discuss your needsA call, a site visit or a sample.
  2. We offerScope, schedule and price, in writing.
  3. We install and we trainOur systems on your site, your teams trained to use them.
  4. We stay by your sideFollow-up, support and maintenance, for as long as you wish.
Short term

A batch of samples, an interpreted report.

Long term

An analysis programme tracked campaign after campaign.

Let's discuss your project
With
McGill University
University of Birmingham
Pyramides Inter
Based in London, Ottawa and Yaoundé, we bring these skills to Central Africa.WhatsApp +1 514 651 4977 · Cameroon +237 6 99 00 33 15
Call